1. You should include a graph of your results. If you are not sure of what to graph, come and ask me, but the general rule is this: try to rearrange your equation so that the result you are trying to find is related to the gradient of the graph.
Say you are calculating acceleration using F = ma. If you draw a graph of F against m, your line gradient will give you a.
A more complicated example: If you are measuring the density (ρ) of spheres of the same substance, you could use
ρ = 4Πr3/3m
Rearrange this to
r3 = 3ρm/4Π
So if you plot r3 against m, you can find the density from the gradient: 3ρ/4Π
Why calculate from a graph? Using the gradient of a straight-line graph is a much better way than an average to calculate your result, as it puts more emphasis on results closer to the trend, and ignores outliers.
2. So you know what to plot - how do you plot it?
It is worth plotting at least one graph on paper, rather than using excel, as excel is stupid. It cannot tell what is an outlier and what isn't. You, in contrast, are not stupid and can judge things very well by eye.
Step 1 - draw your points. These should be your averages for each value - remember you should document ALL your results, but ignore any obvious anomalies when working out your average.
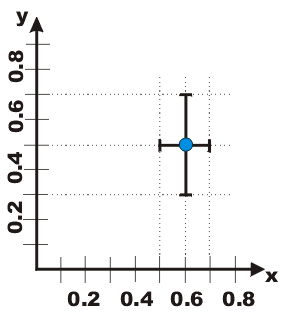
Step 2 - error bars. These should be in both the x and y direction. The errors in your dependent variable should go from your smallest to your biggest result. The errors in your independent variable should simply plus and minus the error in your measurement of that variable.

They should look like this:
Examples:
I'm plotting my F=ma graph, and for a mass of 1±0.1kg I had F values of 1.00N, 1.20N, 1.30N and 3.00N. Ignoring the 3N outlier, we calculate the average: 1.17N and plot our point at (1, 1.17). The horizontal (mass) error bars will go from 0.9 to 1.1kg. The vertical (force) error bars will go from 1.00 to 1.30N. If some of your errors are too small to show up on the graph, then don't plot them.
Remember if you are plotting something squared or cubed, remember to square or cube your error values. If you were plotting m2 above instead, your error bars would go from 0.92 to 1.12.

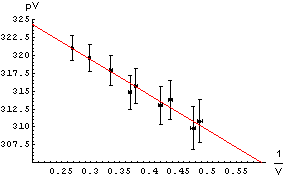
Step 3 - draw your line. This is a single straight line that follows the trend of your results. Calculate the gradient of your line, and this will give you your value.

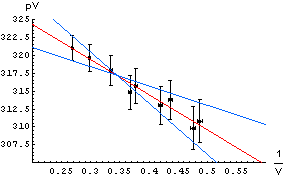
Step 4 - errors in your value. This is a good way to work out errors in your result. Draw two extra lines on your graph with the maximum and minimum gradients possible that still fit within most of your error bars. Calculate these gradients, and they should give you a maximum and minimum for your value that fit your results, and thus a range for your result.

thanks for helpful explanation. but one question, if you are varying a load resistance in a circuit, and plotting I against V to find the internal resistance from the gradient , you are plotting two dependent variables, so in your error bars would you just plot highest and lowest value for both I and V?
ReplyDelete